Our Final Draft

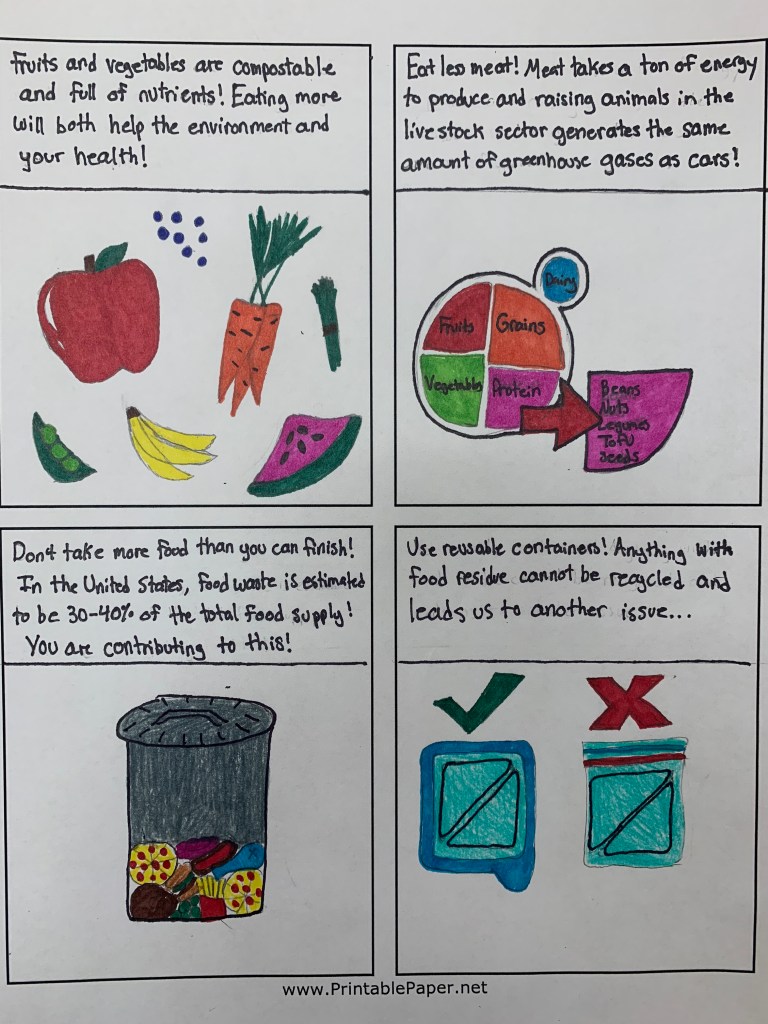
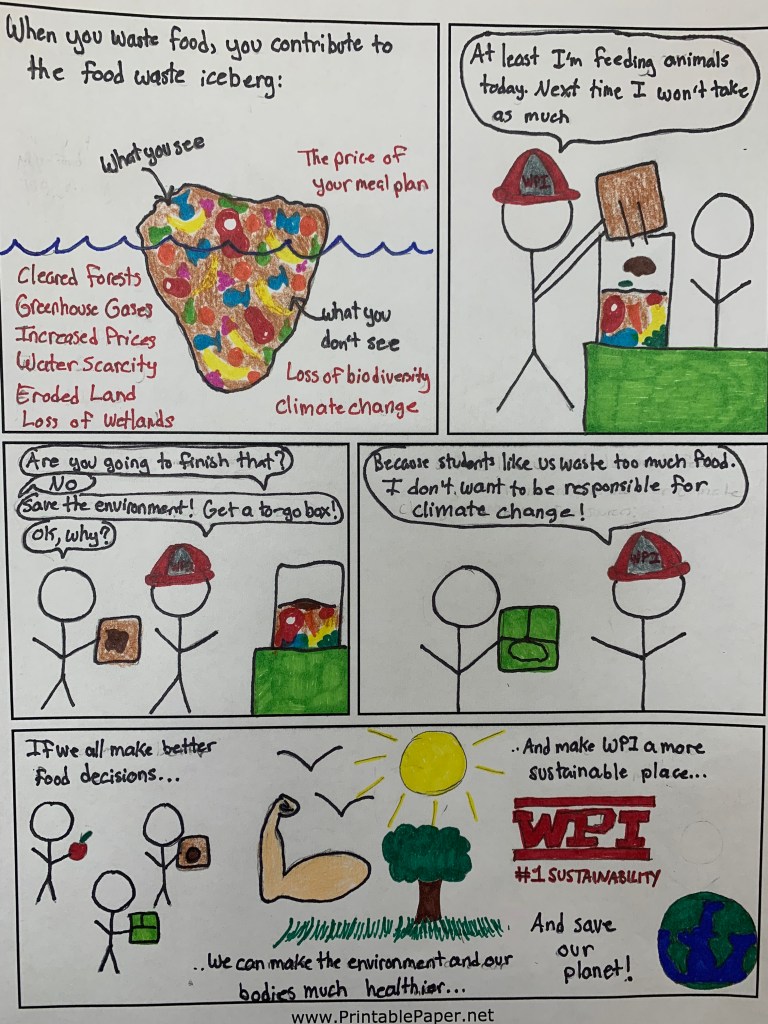
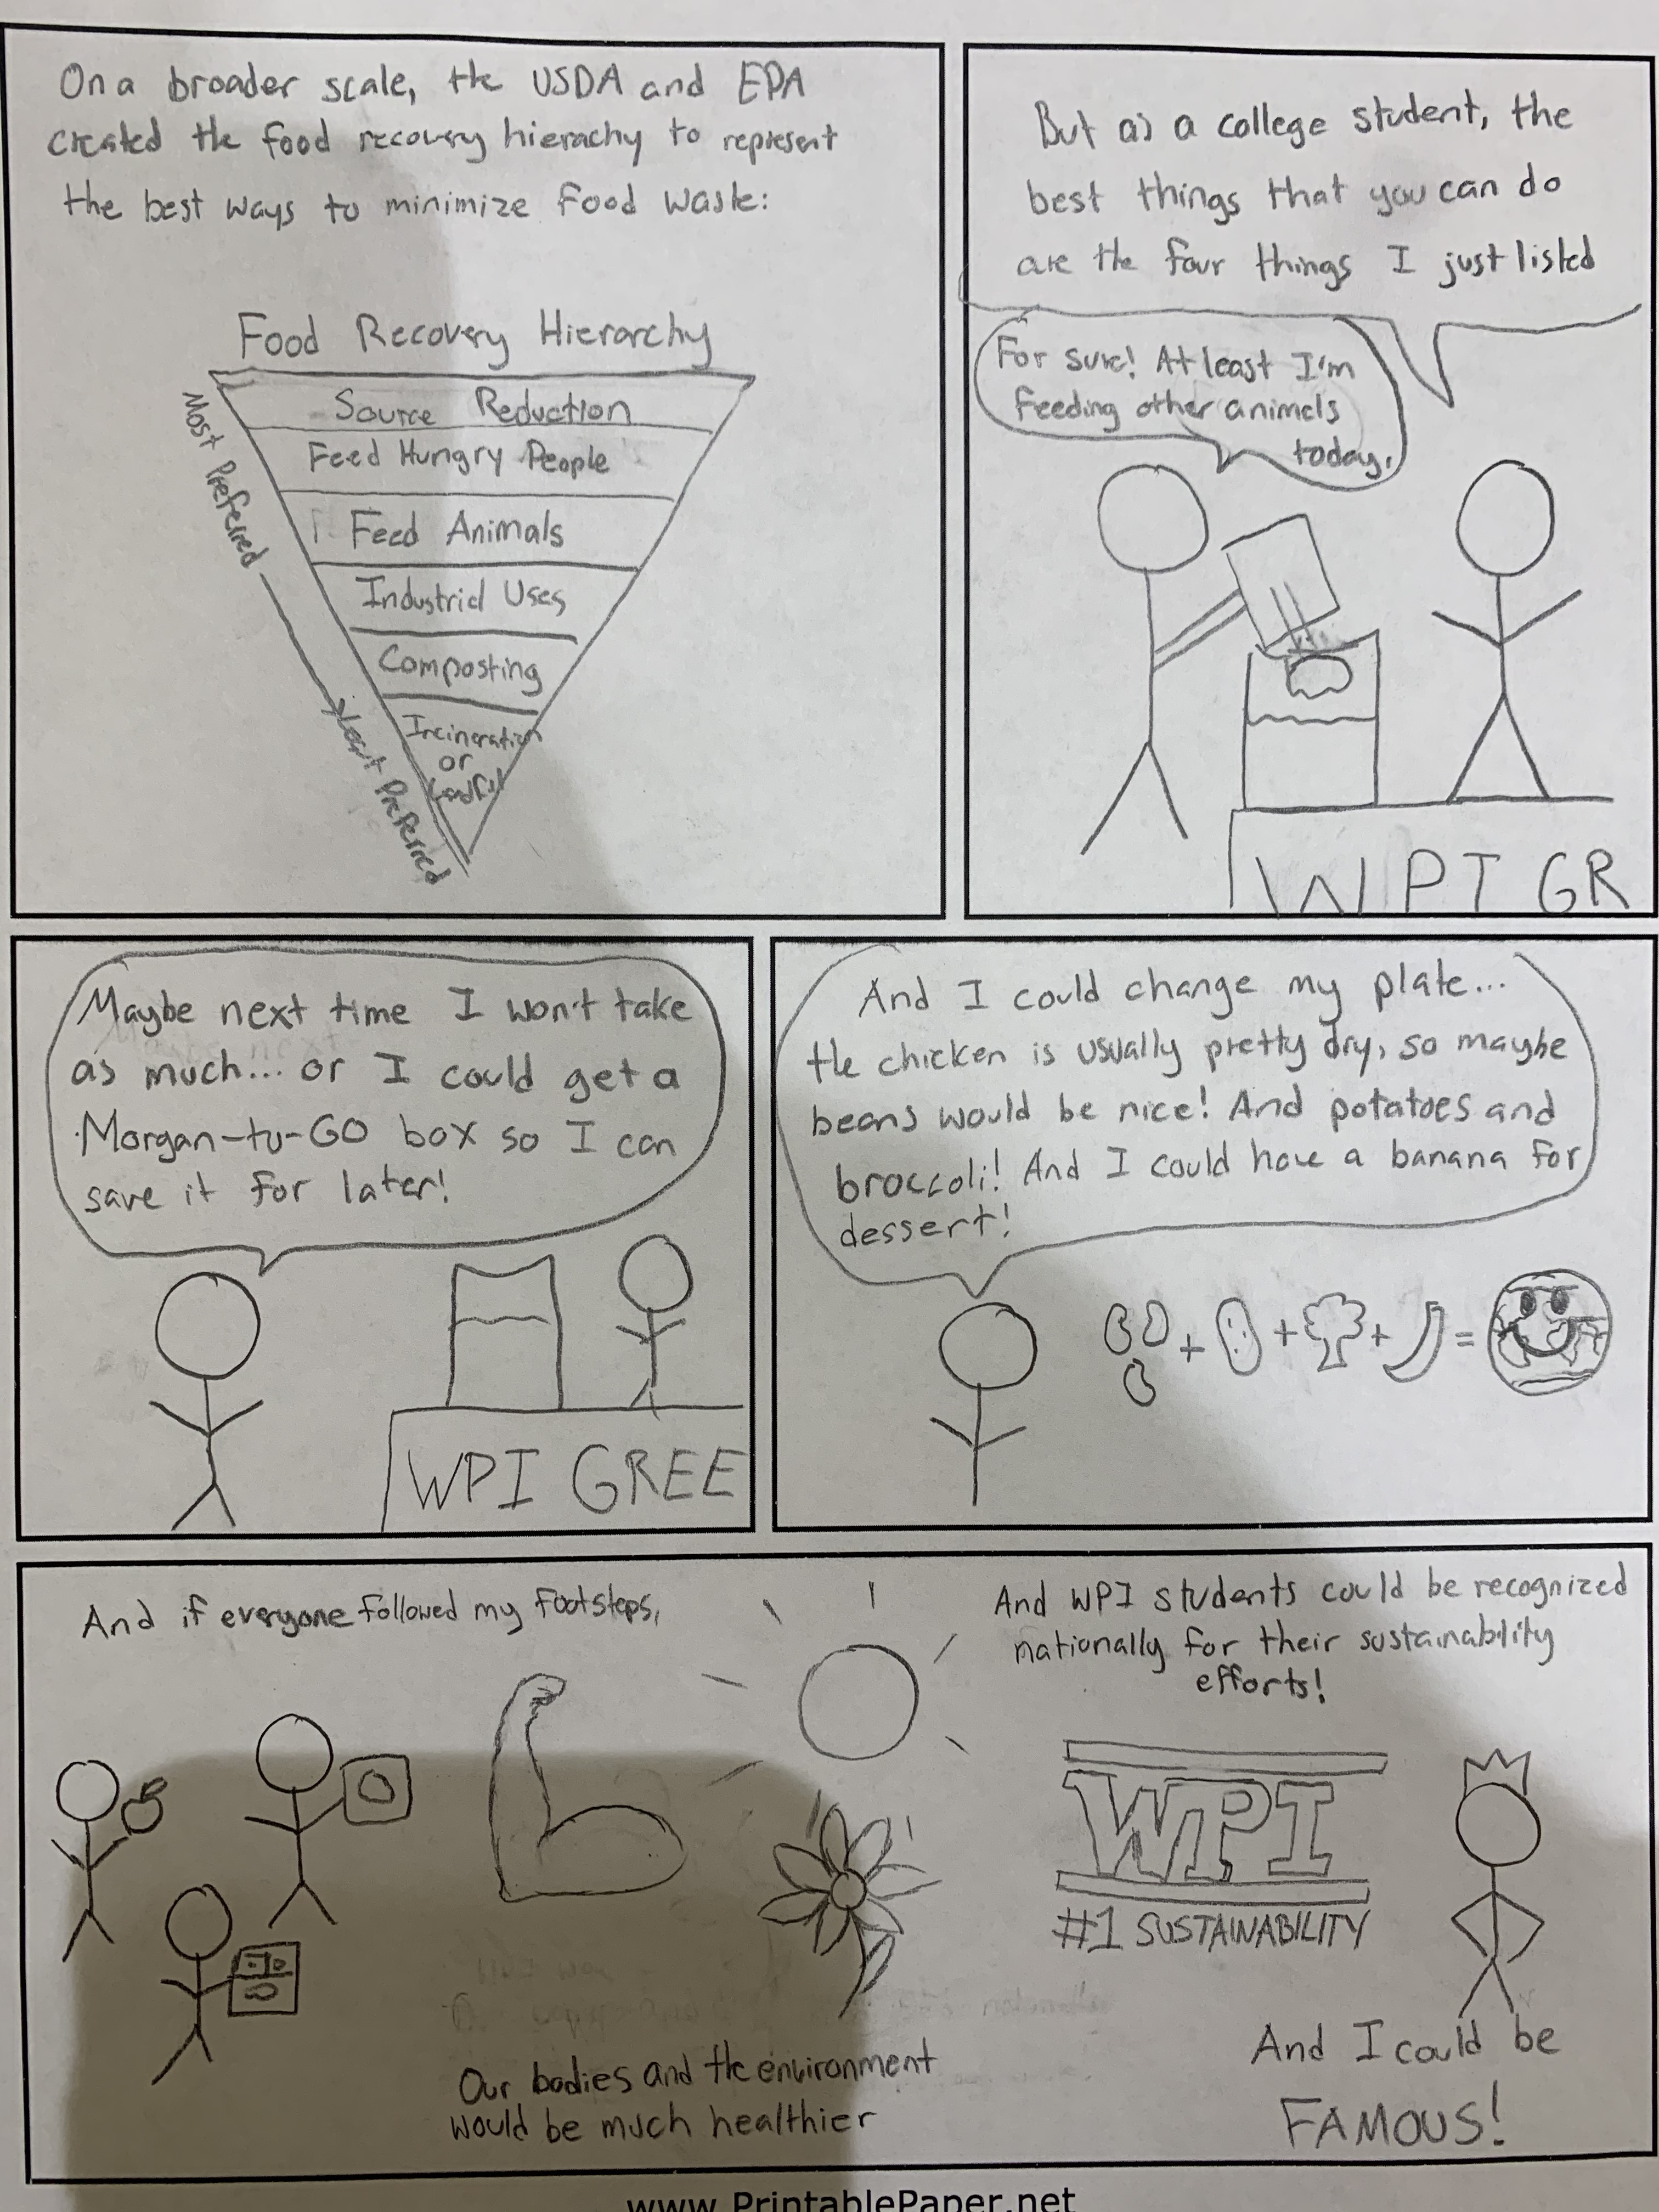
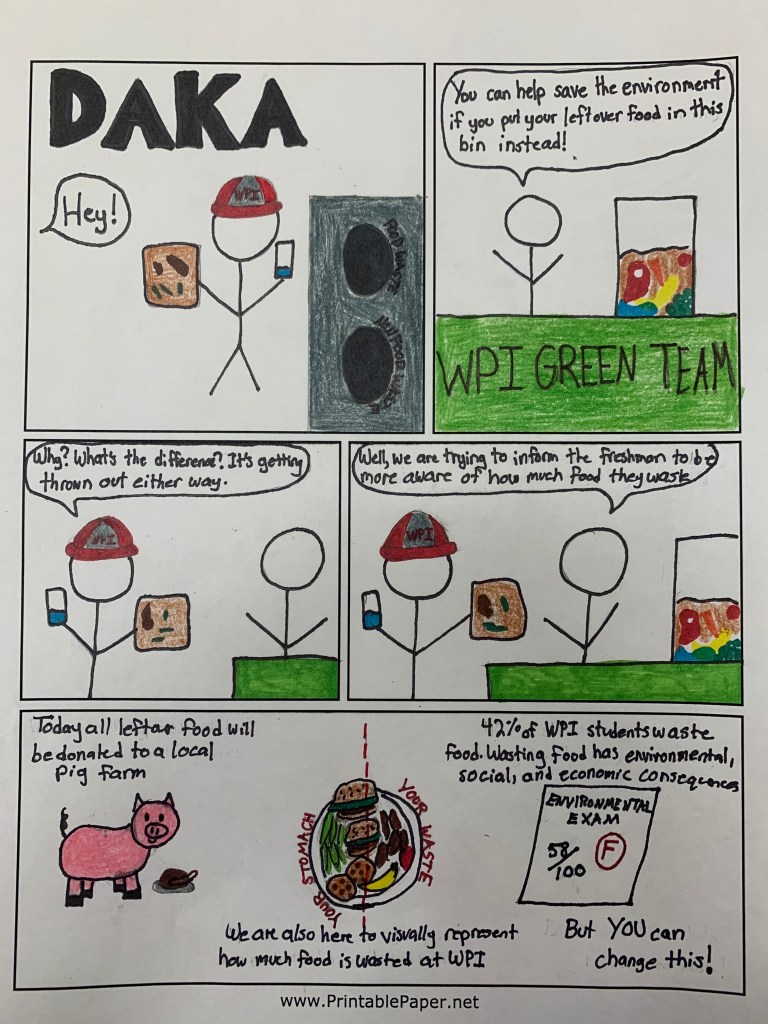
For our final draft, we decided to color in our comic by hand (neither of us have experience using illustrator). Some feedback we received on our initial draft was that it was very clean, and we felt that because of its cleanliness and hand drawn style it would be more appropriate to color it in by hand. We are planning to hang our comic up in the Morgan dining hall, so right now we don’t envision our comic online (besides this blog, of course). That being said, we chose a color pallet that will allow the comic to be easily replicated.

Here it is:
Page 1
Page 2
Page 3

We made certain changes based on the feedback. The biggest adjustment was that our comic was mainly using the logos Aristotelian appeal. Our comic was missing ethos-a character connection with our audience-and pathos-a sense of why we would want our audience to make sustainable decisions and how these decisions affect them. To increase ethos, we made the student in our comic wear the WPI hat that all freshman receive at orientation. This way our previously arbitrary character is easily recognizable as a new first year student at WPI. To incorporate pathos into our comic, we made adjustments to the dialogue. On the first page, the member of the WPI Green Team now explicitly states that freshman, specifically, waste food in the dining hall. On the second page, the WPI Green Team member explains the things that the student can do to help themselves and the environment–and makes them feel responsible for the consequences. On our final page, we changed the Food Waste Triangle to a Food Waste Iceberg–this concept is to display all of the consequences of wasting food that students don’t see once they dump it in the “Food Waste” bin. The purpose of including this is to make the student feel like they are adding to the iceberg–and is a call to action to reduce waste. When a student with food waste approaches our first year student in the comic, he convinces the other student to get a to-go box because he feels guilty. We hope that our comic will show students that the decisions that they make do have an impact on the environment, and that they can encourage others to make the same sustainable decisions.

Here is link to another blog that describes ethos, logos, and pathos used in comic strips.

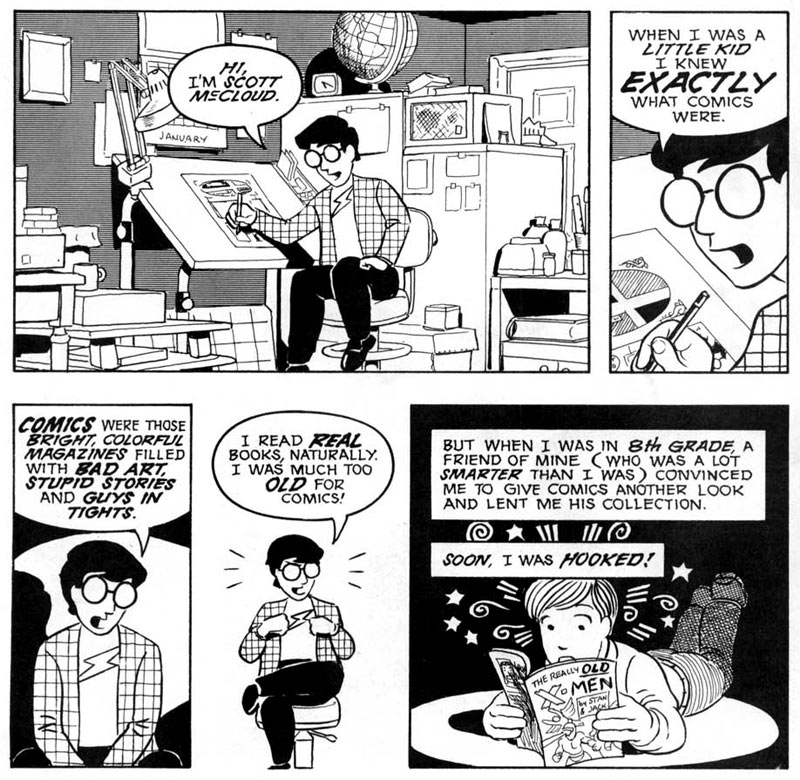
In Scott McCloud’s comic Understanding Comics, McCloud emphasizes that a comic’s function is to “show and tell,” and that comics can be scholarly or informational (McCloud). We believe that the final draft of our comic is set up to show a real-life scenario that first year students can relate to and tell the storyline behind it. The narration in the comic includes statistics and facts about food waste, giving the comic an educational tone rather than silly (as some people would perceive comics as).
Now that we’ve shown you our final comic, please tell us what you think!


Sources:

McCloud, Scott. “Writing and Art” in Understanding Comics: The Invisible Art.2 Ed. 1993, Kitchen Sink Press.  1st print: New York, HarperCollins.  1993.

If you are interested in seeing where we got the information for our comic or learning more about food waste, check out the following links:
Feedback: Summary and Implications

So in class we received feedback on our first draft as seen below:

Feedback we received

The Comic’s drawing style is good and applying computer touch up is not necessary – So one feedback item we received was that the way in which our comic is drawn using stick figures and hand drawn images is a a good format and doesn’t require change. However this feedback was tempered with a recommendation that we should work on coloring in our comic so as to draw attention and increase its appeal.

Adding a reason WHY to do the things the comic says is imperative to capture the intended audience’s actual dedication to changing their actions – To incorporate this feedback we realized we would need to actually change our final draft of the comic in some key ways from our first draft. Modifications we are looking to add are, some panels representing the bad things that can happen if the student does not follow the advice. Perhaps an expansion on the idea of failure, a failure on the part of the student should they not attempt to preserve food waste.

Our comic has to much dialogue causing it to be hard to read easily – This problem is especially noticeable in the last page so we are looking to make an overhaul that will cut down on the dialogue while still getting the key points across to the audience, in tandem with this although the text on page 2 however the dialogue may seem long but the key is that the point the dialogue reinforces is well demonstrated by the images on each of the four panels.

We want to hear from you!!!

Is there any feedback you want to give us that you didn’t get a chance to in class or that you thought of since?

Do you like our changes or should we be modifying our modifications?

Anything else that you think could be of interest for this project to produce the best final product to change sustainability at WPI?

Sustainability Comic: Our First Draft

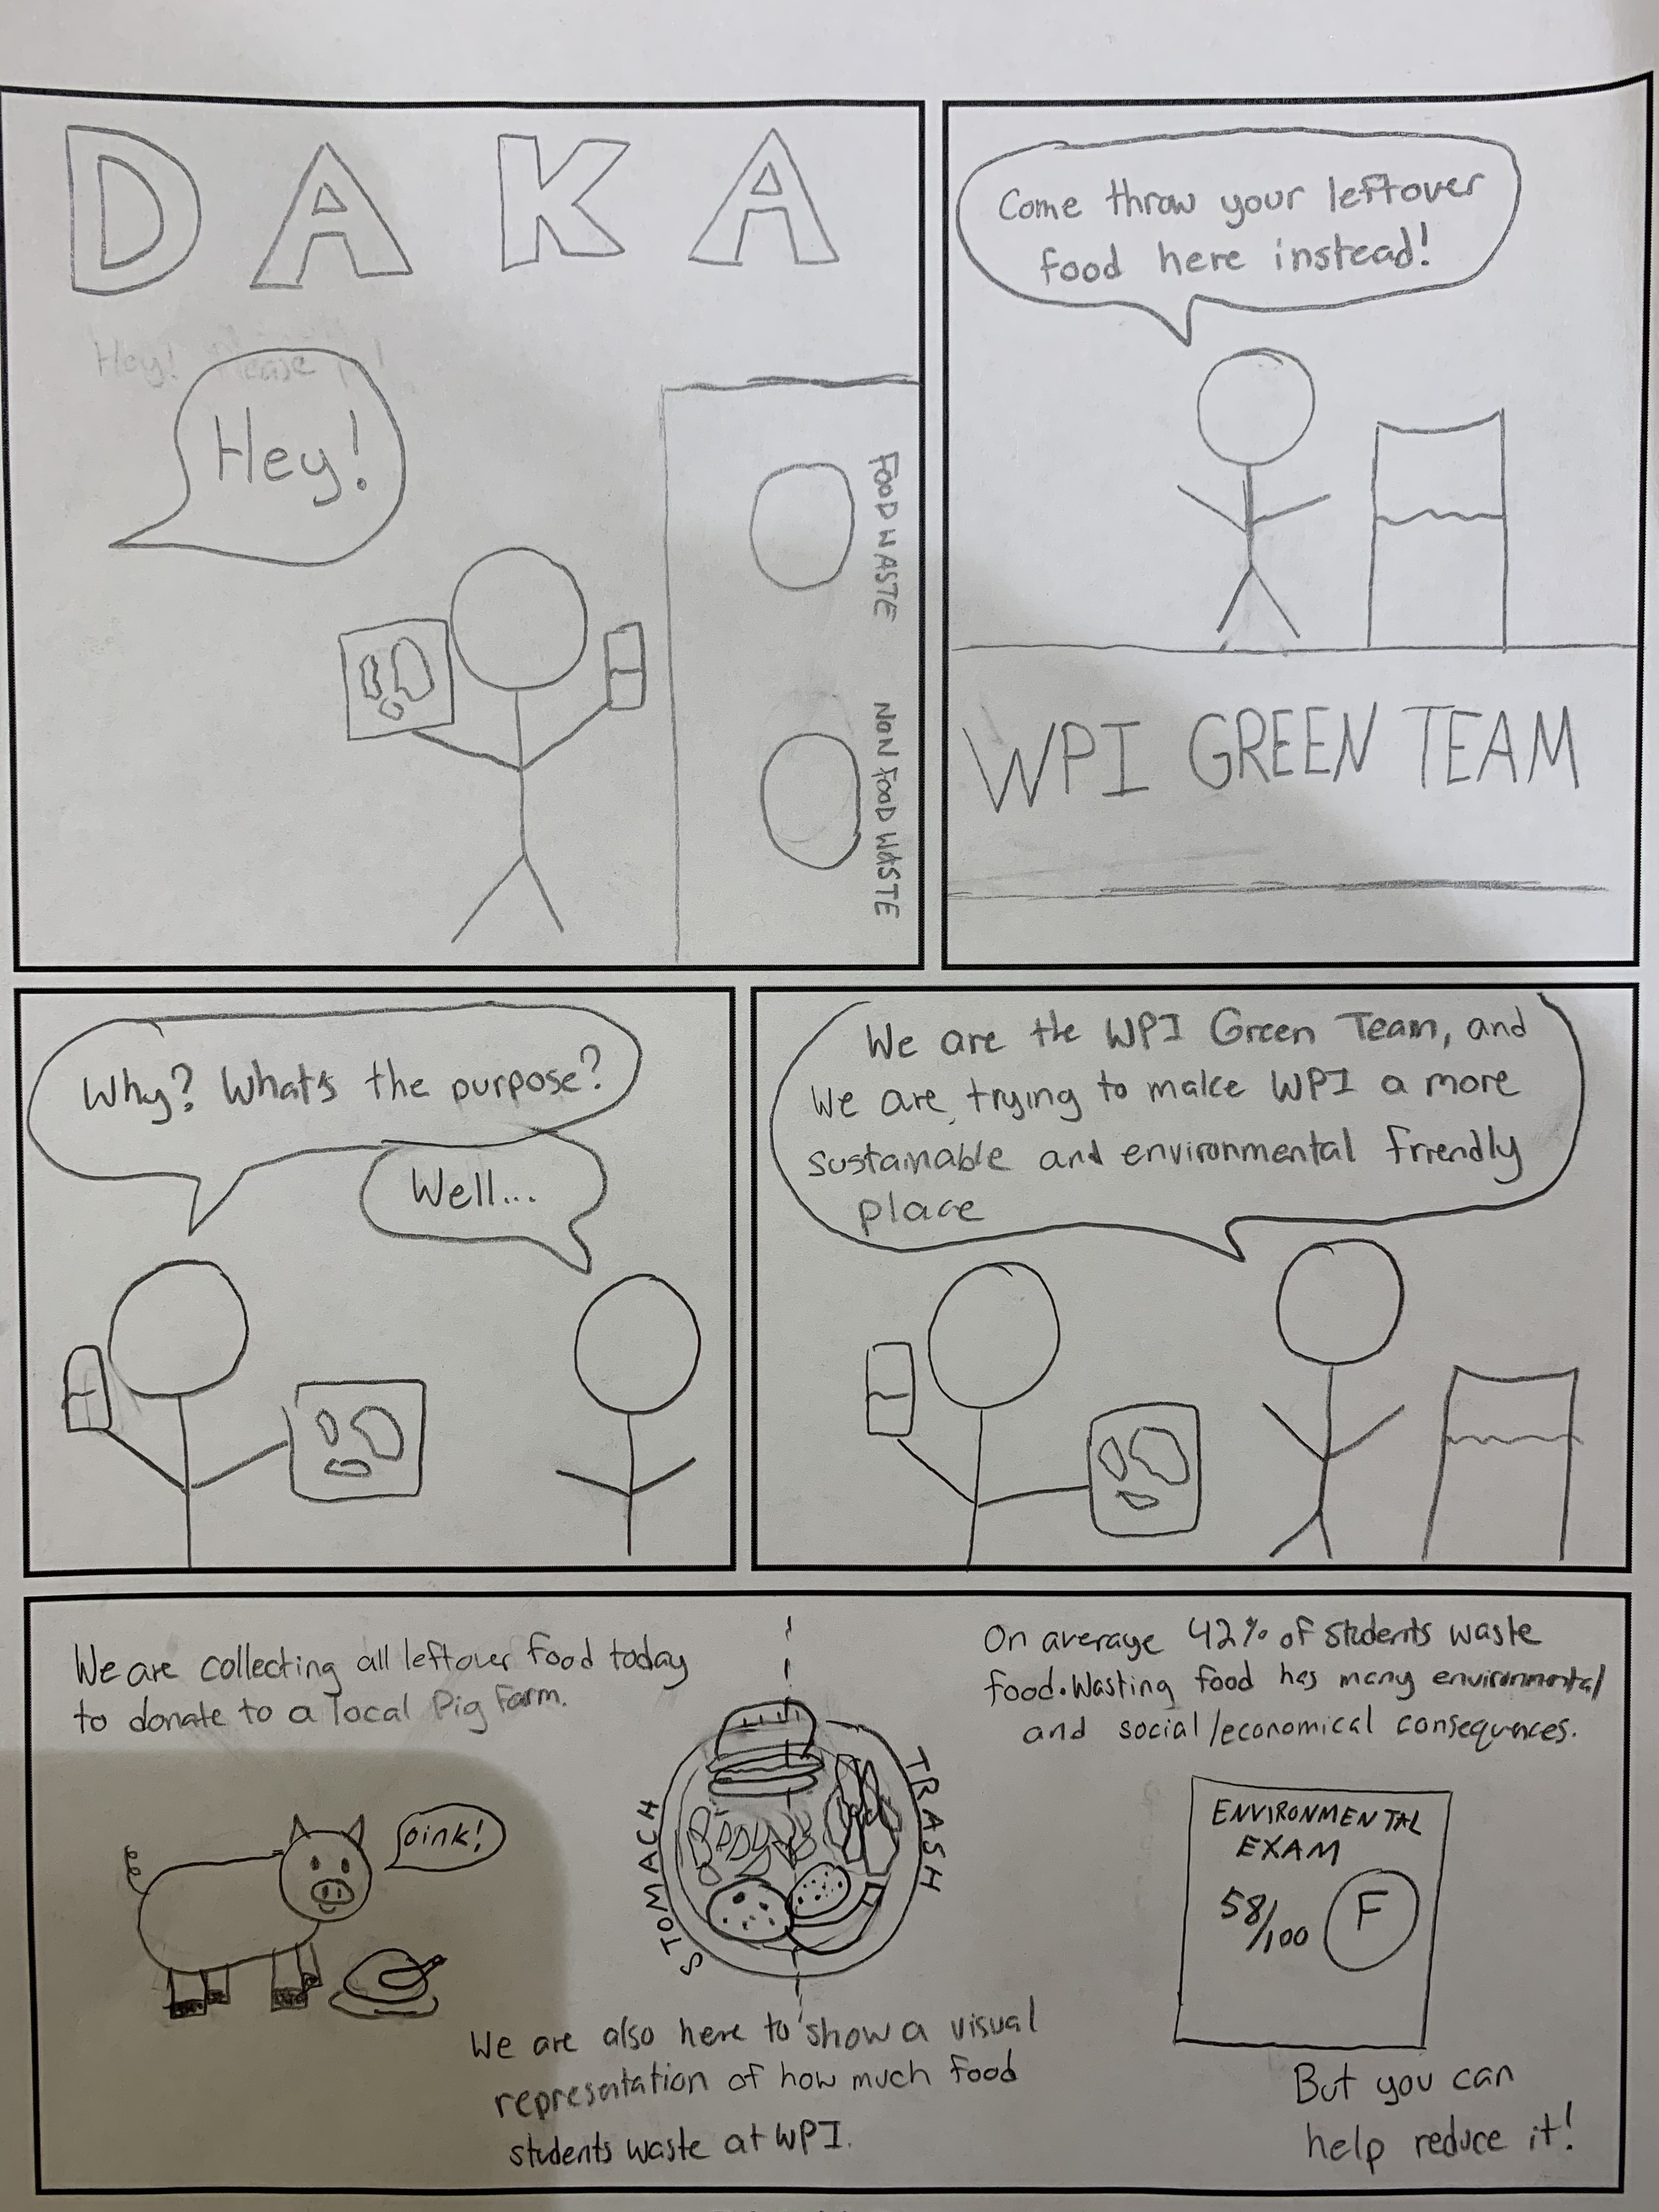
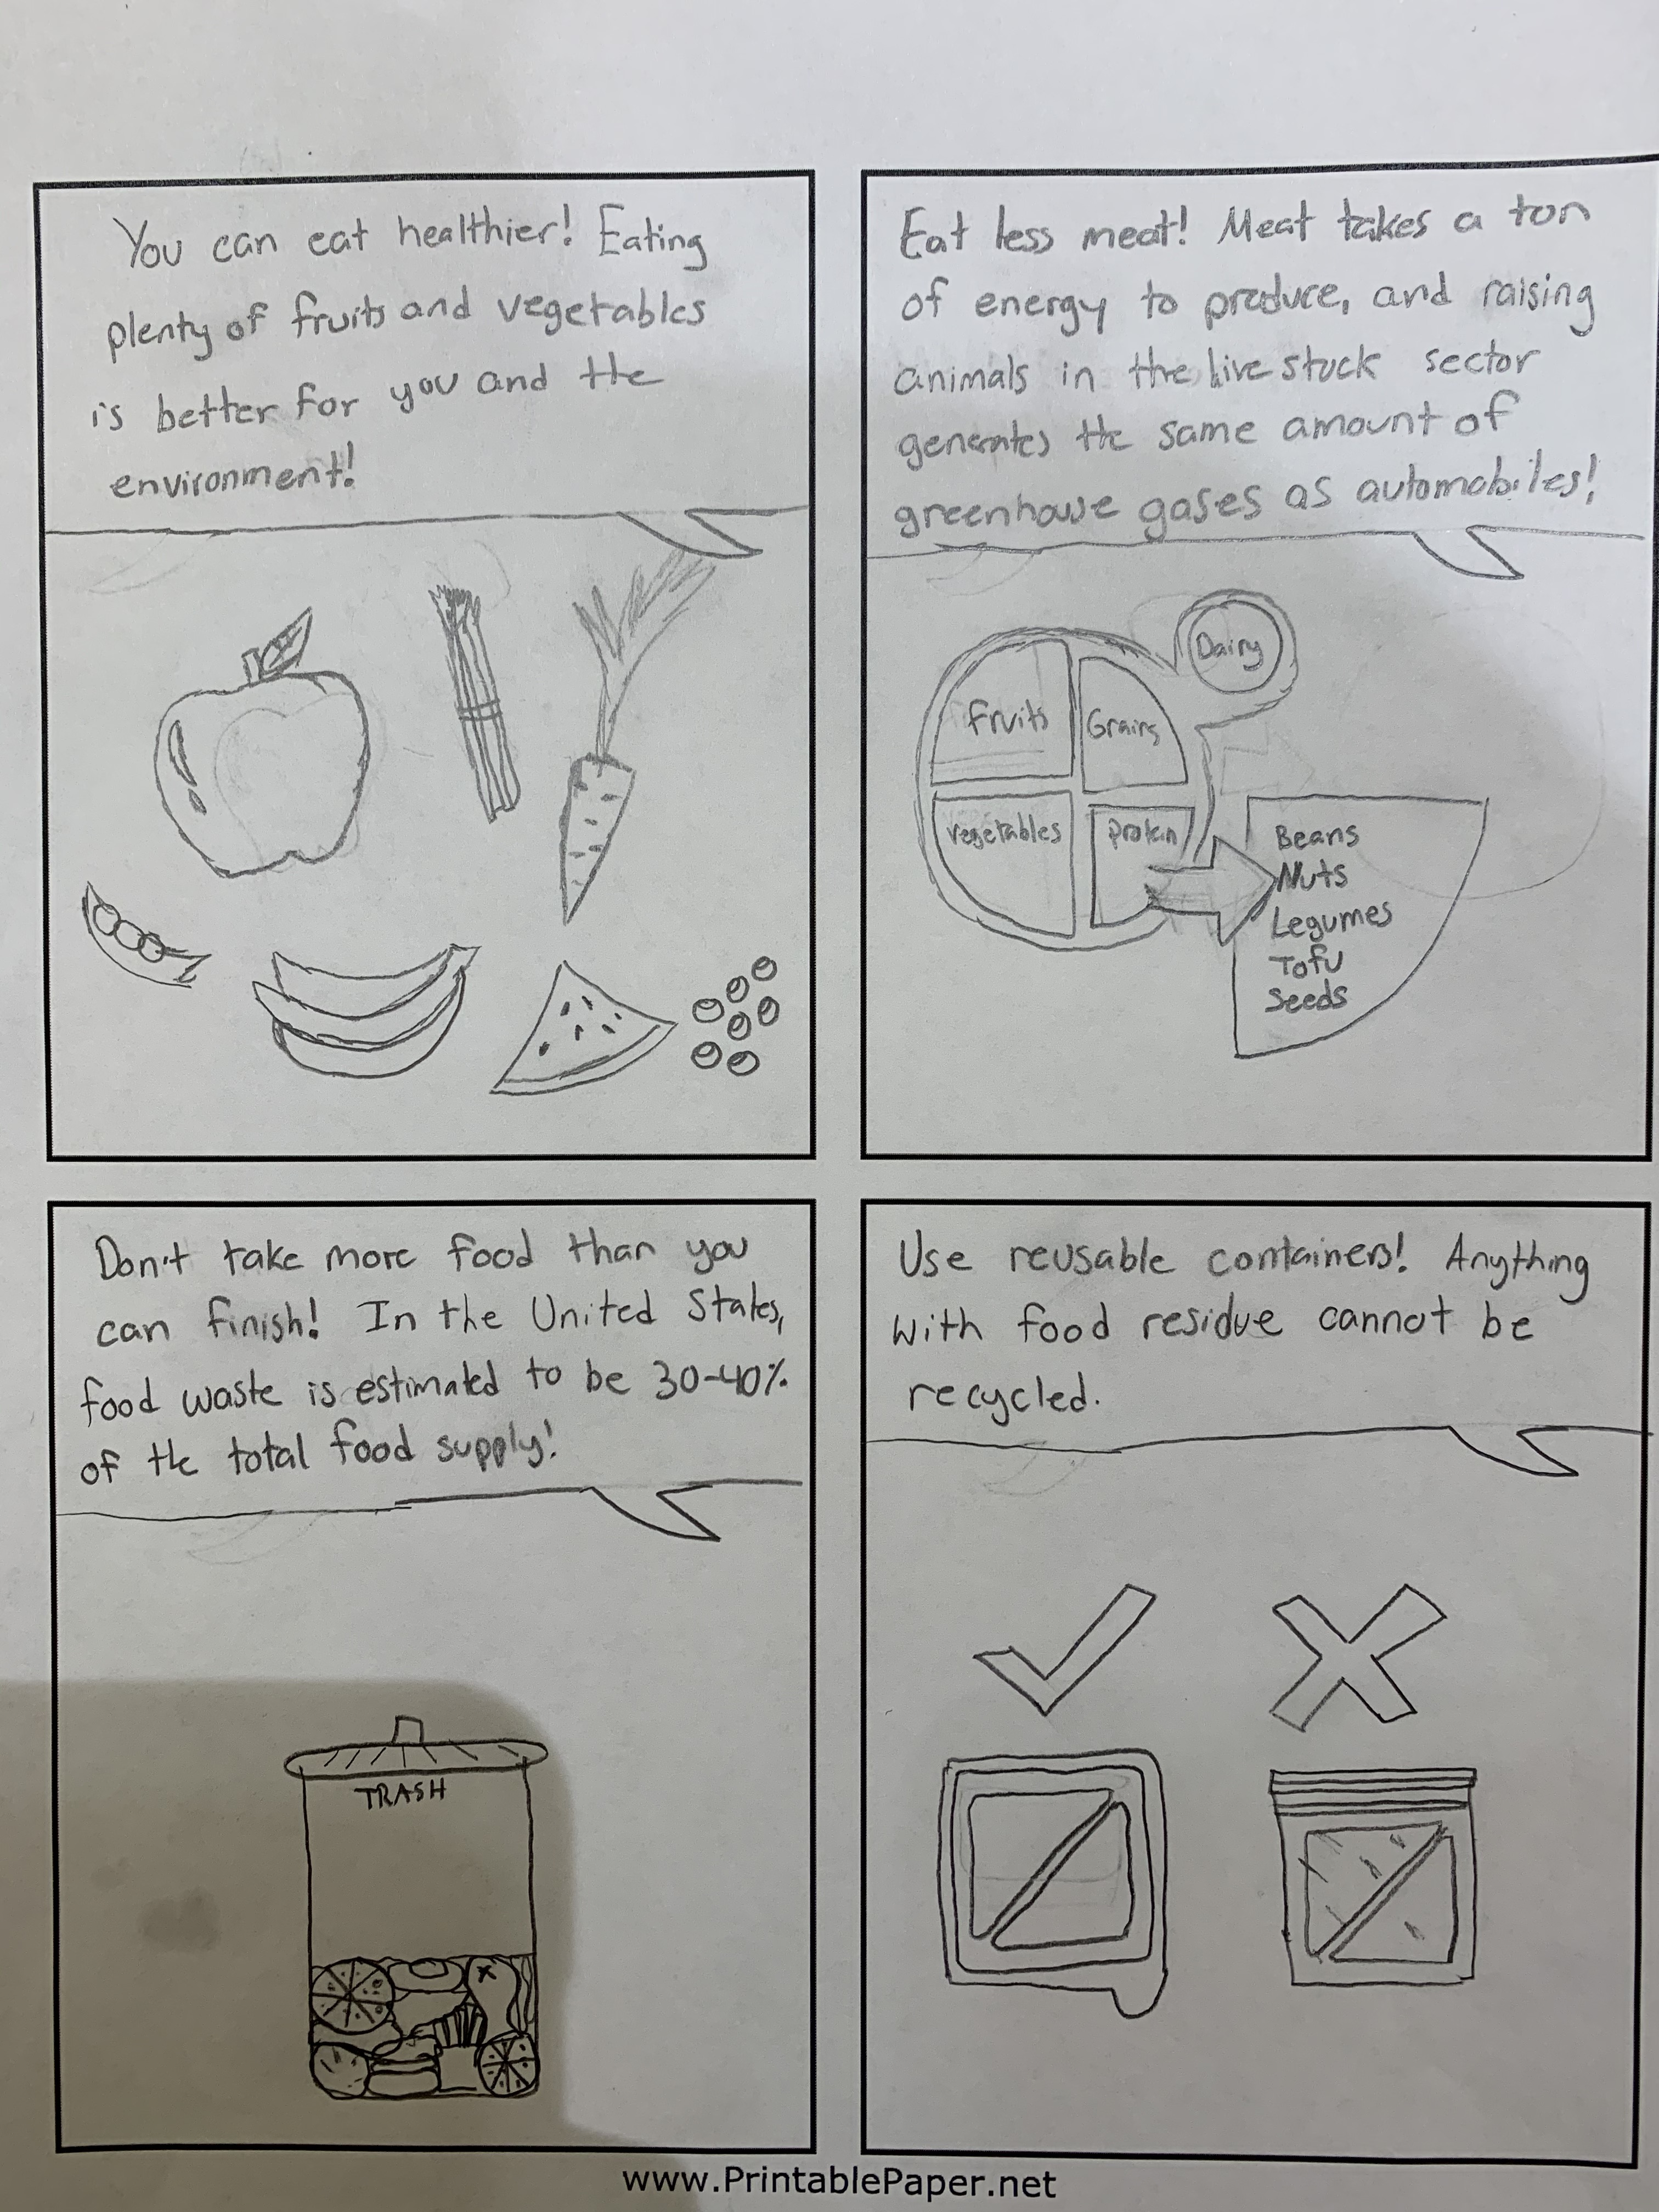
We decided to focus on reducing food waste at WPI. The intended audience for our comic will be freshman or anyone who eats at the Morgan dining hall. The outline of our comic features a student with a plate full of unwanted food who is stopped by a WPI Green Team member who explains the environmental consequences of wasting food and how the student can make proactive decisions to reduce food waste.

Our plan is to first hand draw the comic, receive feedback and make adjustments, then transform our comic using an online software such as Illustrator (we are open to other suggestions too!)

One of the hardest parts of creating a comic is how to balance words and pictures for rhetorical maximization. In Scott McCloud’s Understanding Comics, he highlights many different ways one can combine words with pictures:

  • Word specific–words capture main idea, pictures don’t add meaning
  • Picture specific–pictures show all, few words to add “sound”
  • Duo-specific–words and pictures say same thing
  • Additive–amplify one another
  • Parallel–words and pictures tell different stories
  • Montage–words are in integral part of the picture
  • Interdependent–neither word nor picture can stand alone to convey a message

(McCloud).

Our goal is to include many (but maybe not all) of these combinations so our comic is not too picture heavy or word heavy.

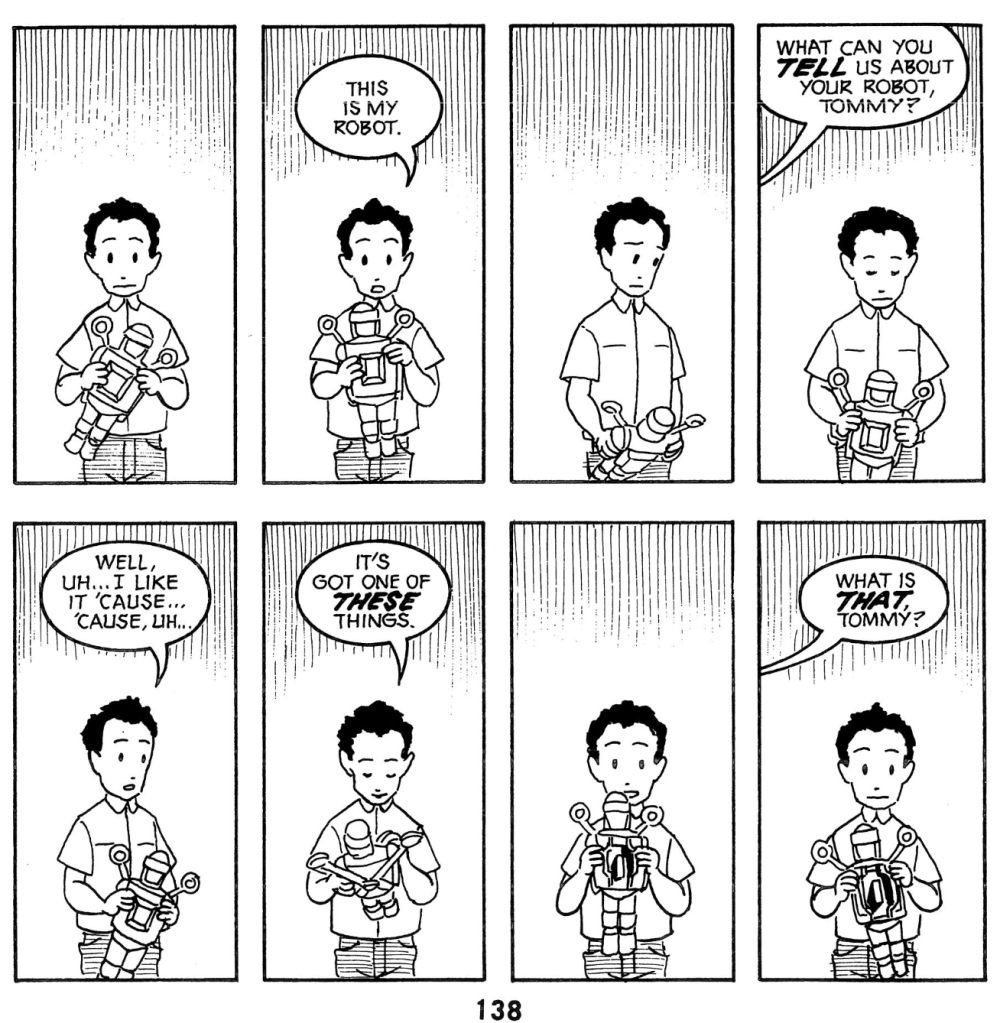
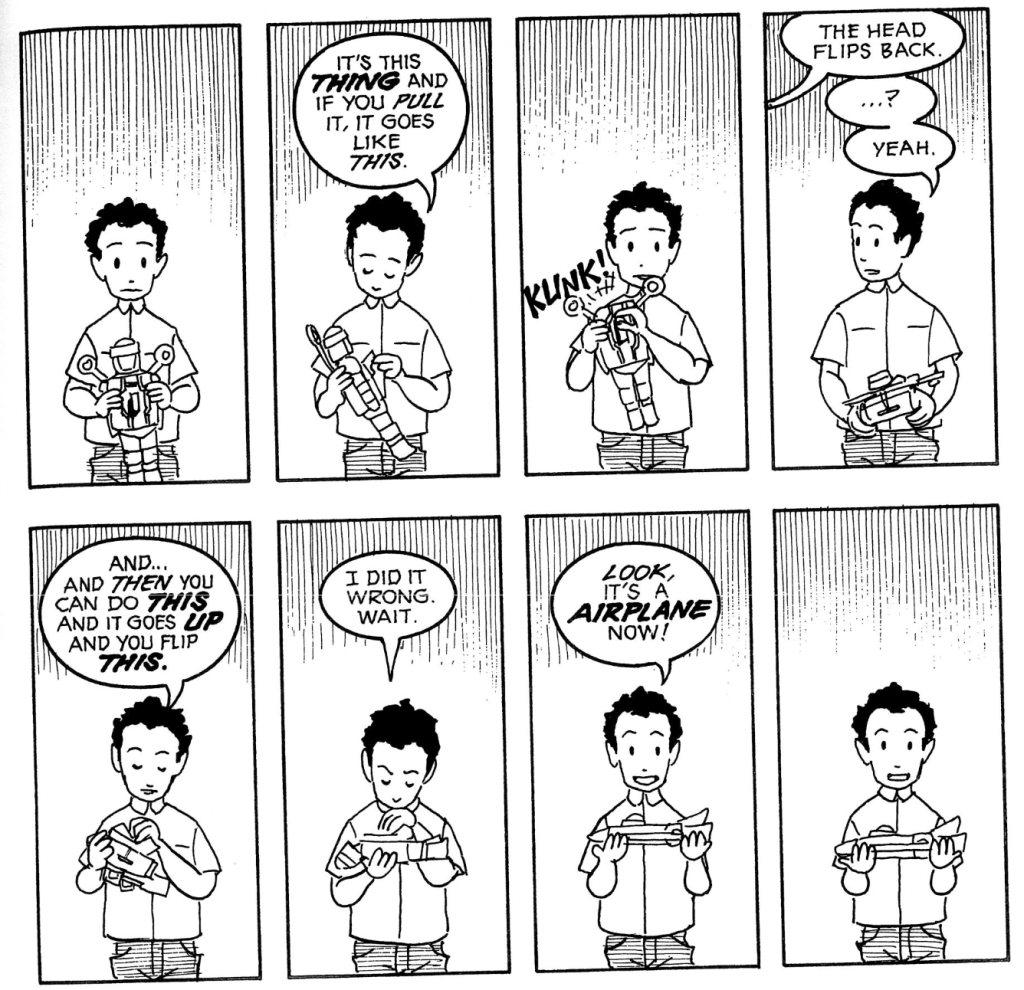
Below are some examples of different comics. As you can see, comics follow a wide range of picture and word combinations.

Here is a first draft of our comic:

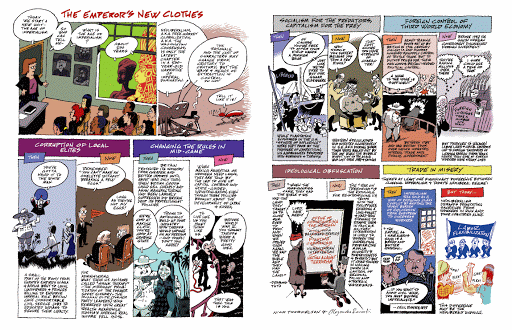
Our comic features a direct dialogue between a student coming out of DAKA and a member of the WPI Green Team. The bottom box on the first page, entire second page, and first and last box on the final page have different relations with picture and text. We tried to include elements of montage, additive, and interdependent relationships to vary the layout and rhetorical impact of our comic.

We started with a blank pre-made template and planned our comic around it. Did other people use this strategy or is there a different method that students used to create their comic?

As this is just a rough draft, we are eager to hear what our classmates have to say about our comic. We appreciate both positive and constructive feedback!


Sources:

McCloud, Scott. “Writing and Art” inUnderstanding Comics: The Invisible Art.2 Ed. 1993, Kitchen Sink Press.  1st print: New York, HarperCollins.  1993.

Comic Project: Background

We began our project by working to educate ourselves on the background of the project at hand. Neither one of us had any deeper knowledge about the sustainability programs available on campus that we could produce a quality comic about.

Fortunately WPI offers a number of easy ways to learn about sustainability groups on campus. After walking through all the offered projects we made our decision to focus on the food sustainability programs on campus.

Our first on campus opportunity that we looked at was the Food Recovery Network, this on campus network works to decrease the wasted food that occurs throughout campus from the CC all the way through to freshman dorms. Students and faculty are constantly throwing out and disposing of unopened food items that can be donated to those less fortunate who desperately need food.

Our Second sustainability program that we researched to add to our comic was the Green Team.

The Green Team is a “The WPI Green Team is a student run organization dedicated to making WPI a more sustainable place and educating the WPI community about sustainability.” (http://greenteam.wpi.edu/)

These two programs are going to be our main focus within our comic.

Our next step was to figure out a comic format for our comics, we decided on a simple online comic template an example of which is shown below

This Template and others like it will allow us to draw our comic easily and control the organization better than hand drawn boxes. We plan on using Illustrator to create our final comic but will stick with hand made comics so as to more easily incorporate feedback and critique that we may receive both on the blogs and in class.

To complete our research we discovered a fantastic resource (Which anyone reading this Blog can feel free to also use) an IQP called “Food Sustainability at Worcester Polytechnic Institute” (https://web.wpi.edu/Pubs/E-project/Available/E-project-030411-184854/unrestricted/Food_Sustainability_at_WPI.pdf) this IQP had in depth information into many of the on campus sustainability opportunities as well as useful statistics and other data that can be incorporated into our comics as needed.

Questions we are still considering

How to best format our comic: should we go with a more fun and goofy style like a web comic or should we be more explanatory and straightforward like the McCloud comics?

Which online format to go with for the comic –as there are numerous options ranging from only four panels to a page to as many as 10.

How best to hook the audience so that they are interested in finishing our comic and not merely glancing at it and passing by.

Our next post will have images of our first draft and a deep dive into why we chose the format and images utilized.

We look forward to receiving your feedback on both this post with our background and especially our next post containing our first draft.

Ronan and Nicole

Final Draft

Finalizing our infographic: the breakdown

After hours of trying to learn other software, we finally were able to use Illustrator to create the cruise ship for our infographic (yay!!). This gave us much better results than Autodesk Sketchbook (saved our fingers the pain too). We were able to create the infographic at 300 ppi as our client requested. Additionally, we used powerpoint to create the text boxes where information would be placed and is ultimately how we connected the pieces of our infographic together.

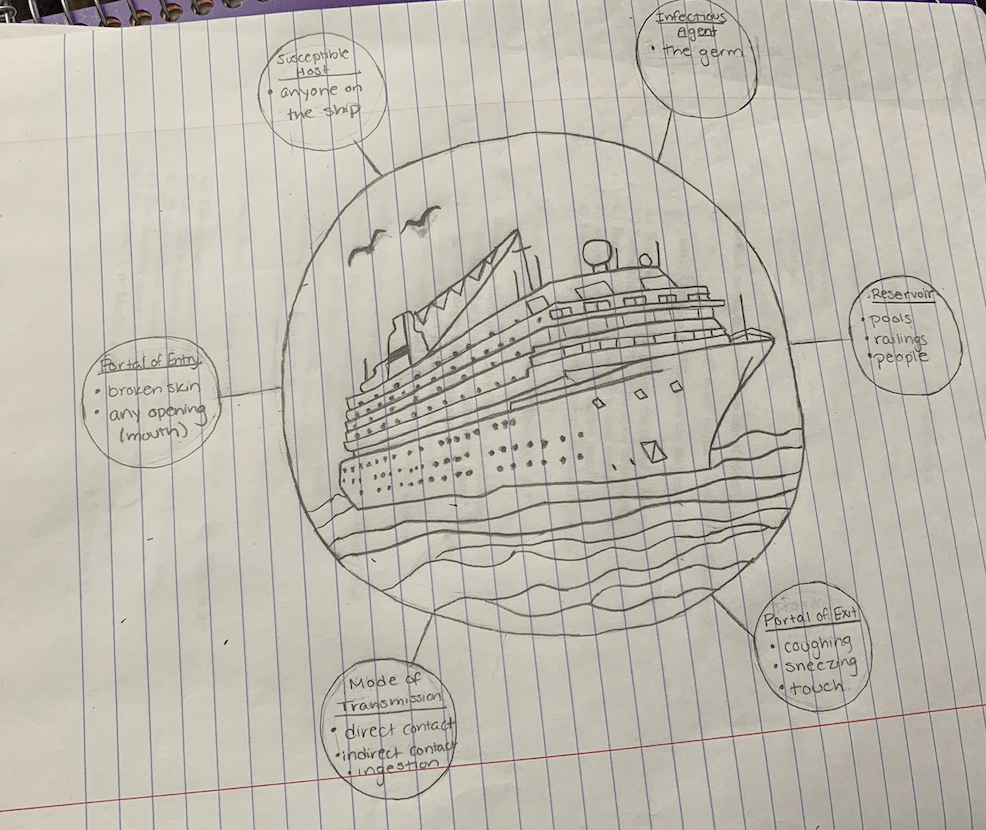
From what started as a pencil drawing:

This is our first draft, again

Has developed to

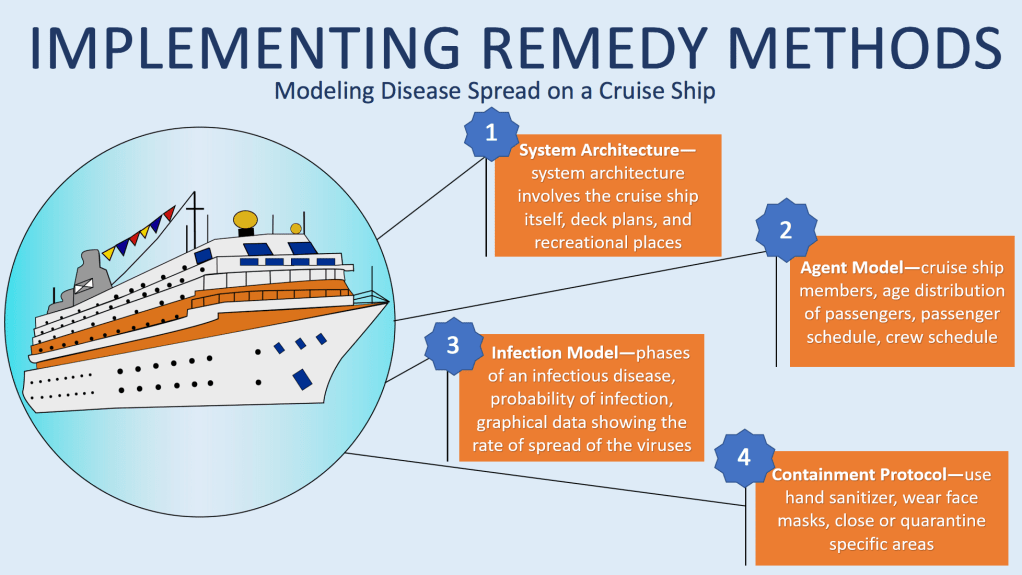
The final draft of our infographic

For our final draft, we muted our colors (as often seen infographics) and stuck to a theme of blue and orange contrasting colors to increase readability. We thought our previous color pallet was too wild and the cartoons too unsophisticated (maybe we could use it for the cartoon unit!). After going to office hours and spending two hours on the ship, we finally were able to use Illustrator. We traced and filled the image in easily and precisely by using tools Illustrator provides. We also simplified our layout to focus on the methodology behind disease spread which was our client’s intended purpose for the infographic. We only included numbered text boxes describing each step of Professor Korkin’s method in the absence of pictures. We thought that although pictures would make the infographic more humane, it may cluster the infographic and turn the viewer away due to the complexity. The text boxes are intended to provide a brief summary of each step in the method, and allow the infographic to have more white space. The white space rhetorically serves to draw the viewer’s attention to the ship and boxes in our infographic, simply because there is noting else there to observe. Even Dragga and Voss admit that no one actually includes humane pictures accompanying data, because on a scientific level, the additional pictures can be distracting and unnecessary (Dragga). Efficiency and readable are prioritized in scientific data rather than humane sensitivity–this is the approach we took in our final draft.

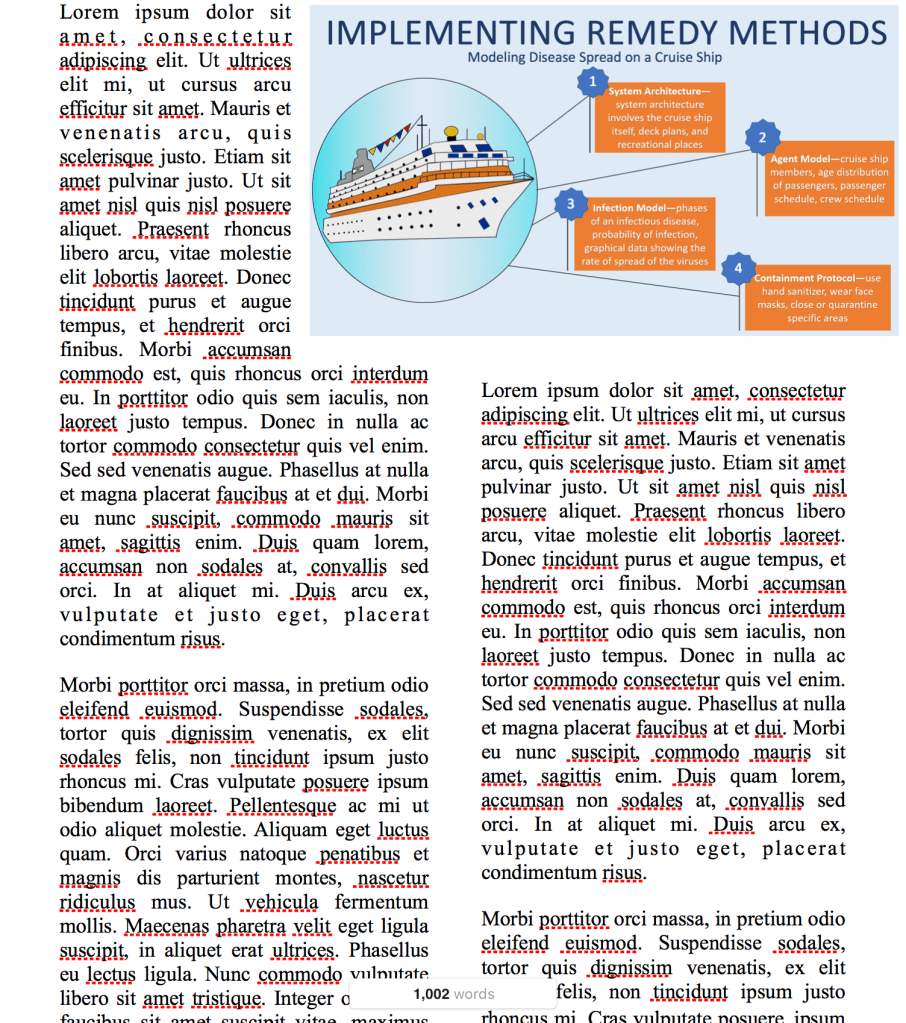
For fun, here is what our infographic would look like on a scientific document:

Our infographic on a document with sample text

Based on where we started, we think this is a huge improvement considering the fact that we had no experience in Illustrator. If we had more time, we would explore other layouts and shapes to display the information. If we get the opportunity to continue to work with Professor Korkin, I’m sure that our final draft will be tailored even further to his liking.

Also, we would encourage everyone to try using Autodesk Sketchbook and Illustrator for future graphic design projects! Autodesk Sketchbook can be downloaded for free here, and Illustrator can be purchased by clicking on this link.

Finally, Professor Korkin is in the news!

The link below is to a recent article on how Professor Korkin developed a 3D model of the coronavirus!

https://www.telegram.com/news/20200211/wpi-professor-develops-3d-model-of-coronavirus

Please leave comments about what you think could be improved and if you like our final design! 


Sources:

Dragga, Sam & Dan Voss. “Cruel Pies: The Inhumanity of Technical Illustrations.” Technical Communication 48 (2001): 265-74.

Class Feedback: upcoming revision ideas

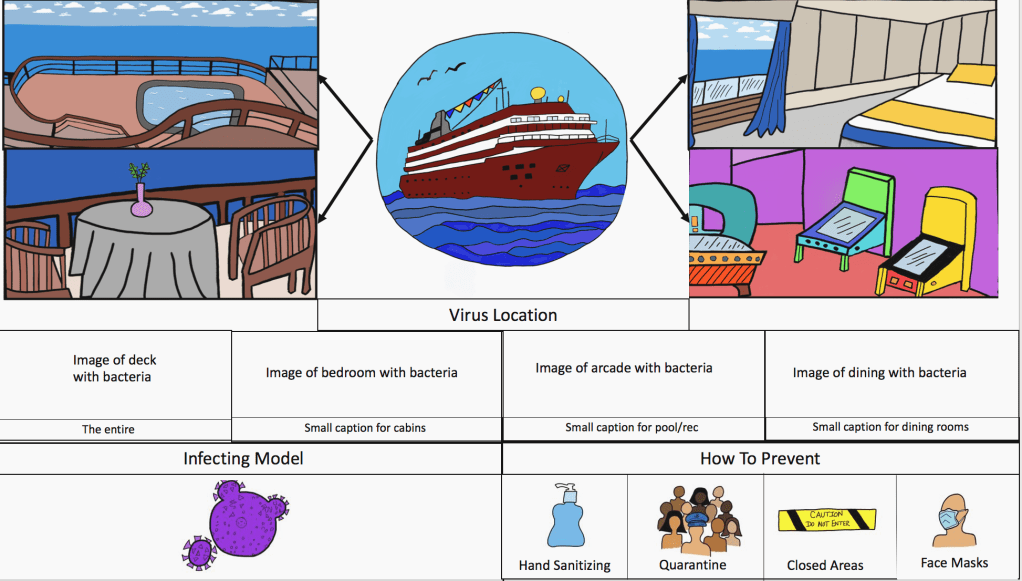
In class earlier today, we had the opportunity to share our drafts with the class and receive feedback. Again, we showed the following image:

Again, our (rough) rough draft

Feedback we received

What people liked:

  • Idea of showing the “zoomed in” virus locations
  • The “How to Prevent” box
  • Combination of elements we have
  • Cartoon-y feel

What we could improve on:

  • Create a better flow in display (people read left to right, up to down)
  • Focus more on the methodology aspect
  • Use a muted color pallet
  • Use illustrator instead of Autodesk Sketchbook

We really appreciated everyone’s feedback today! For our next draft, we are going to meet with Karen to figure out how to use Illustrator. Neither of us have ever used it before so it should be exciting!

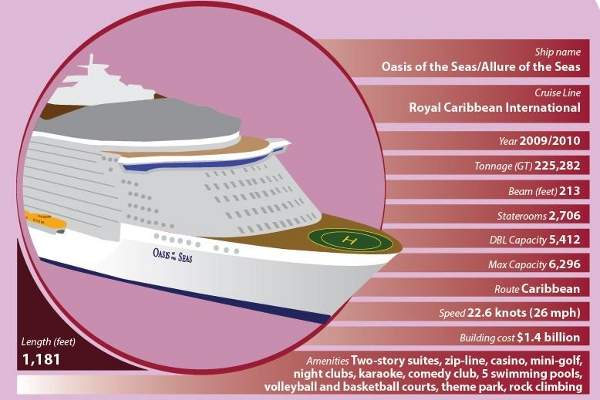
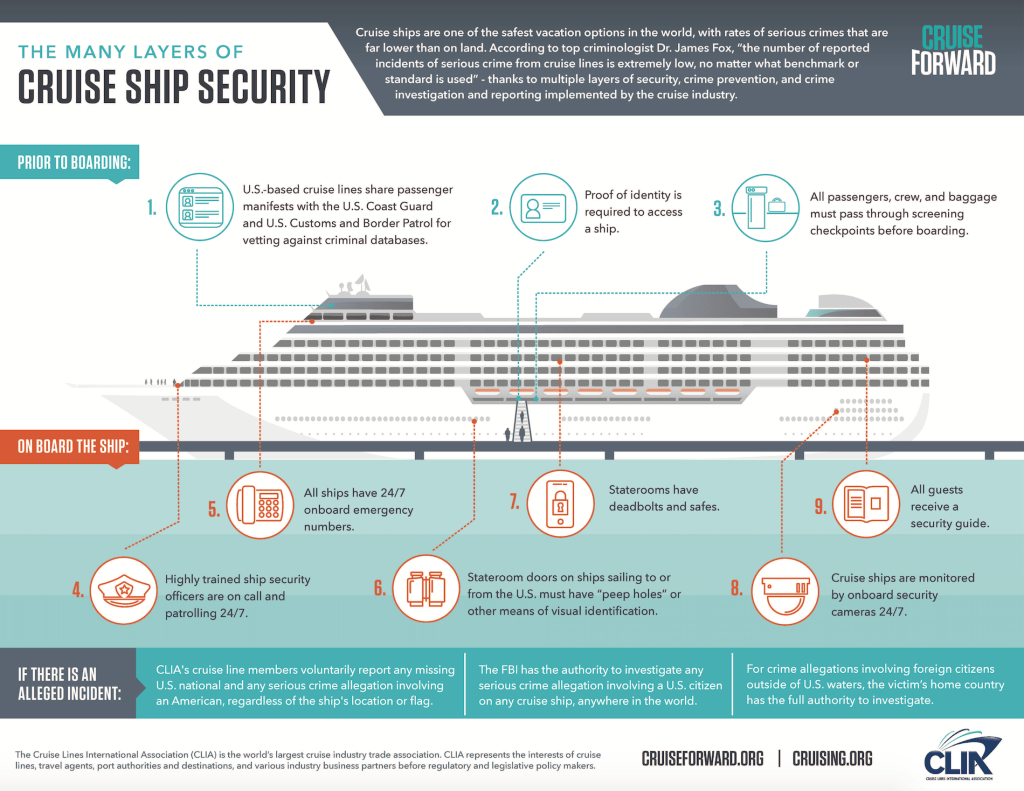
For our next draft, we were thinking of making the layout similar to these images:

We probably won’t use pink, but these images have more of a muted pallet than our previous design. The infographic on the right has a color scheme that we would more likely use. The image on the left has the 3D cruise ship aspect, room for information, and a good balance of text, image, and white space. I think a model like this would be more appropriate for Professor Korkin’s journal. For our final draft, we can envision the previous cruise ship we drew (but different colors) where the one above is now, with viruses floating around it to show it is infected. Instead of lines of data, we could make four blocks coming off, similar to the set up of the infographic on the right, each describing a component of Professor Korkin’s methodology.

Let us know what you guys think!

Bonus Content!!

If anyone is looking for the APA citation for the “Understanding Freud” comic, here is a link to it:

https://www.worldcat.org/title/freud-for-beginners/oclc/4983593?page=citation

And by the way…thanks for checking out our blog!

Second Draft

While working on our second draft, we were provided with much more information. Our client, Professor Korkin, came to our class for a quick project presentation and question and answer session. He also provided us with plenty of information on his method and research via email.

So here is what we are supposed to do, really:

Professor Korkin and his students were researching disease spread on cruise ships and developed a methodology of the best way to counteract it in a real life scenario. Their research was inspired by the recent coronavirus outbreak: specifically on cruise ships.

Learn more about current coronavirus outbreaks on cruise ships here

The infographic will be used in his journal publication if selected. Professor Korkin has the following vision for the chosen infographic:

  • Cruise ship–centered, 3D, show levels, decks, and dining areas
  • Humans –passengers, crew, age, healthy and sick
  • Virus–location, spread, patterns
  • Contamination Protocols–hand sanitizer, quarantine, closed areas, face masks

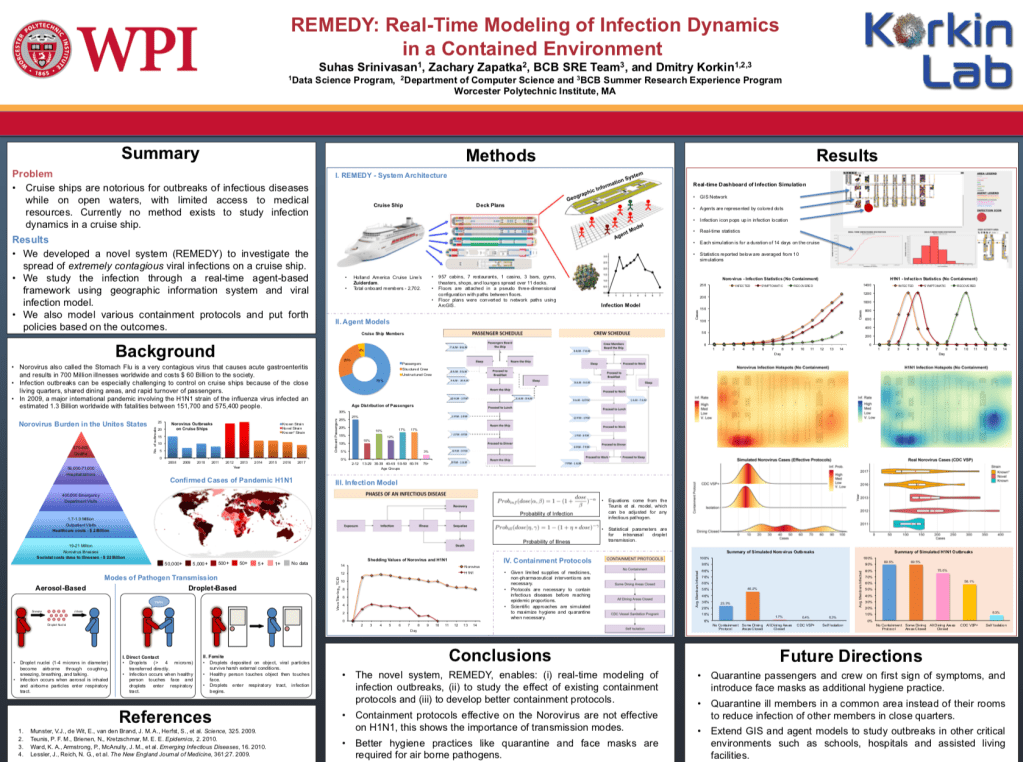
Here is the final poster presentation based off their research:

Final Project Poster courtesy of Korkin Lab

Additionally, Professor Korkin posted a Youtube video modeling how the Norwalk virus (fake disease they choose to simulate) spreads on a Cruise Ship:

Simulation of Norwalk virus on a Cruise Ship. Video courtesy of Korkin Lab

Check it out!!!

Now, time for a second draft

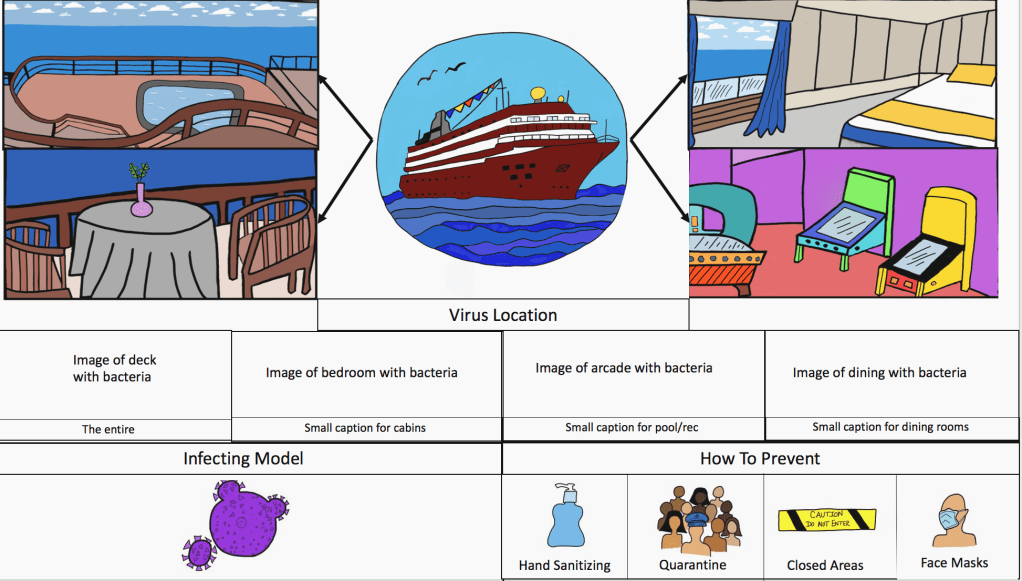
Once we had been given more information, we started thinking of different layouts. We knew our client wanted the infographic to be on half a sheet of paper horizontally which influenced our layout. We decided to split up the page in PowerPoint.

Our second infographic is a huge improvement from the first:

(almost) complete second draft

This version of our draft has the cruise ship in the upper-middle with arrows pointing to the zoomed in sections. Below that section was supposed to be the zoom-ins of the already zoomed-in pictures with viruses on them. We were not able to complete the middle row of images in time to present it to the class (last minute change in device availability) but this is what we came up with. Finally we included the containment protocols by incorporating icons to make the graphic more humane. Ideally, we’d like to reflect the elements that we learned from the readings in our infographic. For example, writers Sam Dragga and Dan Voss argue that technical information often lacks the humanistic approach and just displays the facts (Dragga). Since our audience is epidemiologists, they already know the hardships of disease spread and understand the terrible process; however, we want our graphic to show the positive side in how to stop disease spread. We want the viewer to understand the impact of disease spread on a cruise ship, but then also recognize that no one is doomed by showing Professor Korkin’s methods to subside it.

We need your opinions!

To create our infographic, we hand drew the images and scanned them. We used Autodesk Sketchbook to import and color them. We are open to suggestions if there is another, easier way to create the graphic because this tends to be time consuming in absence of a stylus pen!

We also still have questions of the info for the graphic: how much should be included? Is this something that we will add, or will Professor Korkin add it on top of our pictures? Should we leave room besides the images for text?

Dragga and Voss also suggest including text to compliment the image and provide a sense of ethics, so this is an approach we could look into given Professor Korkin’s preferences.

Will ship + text + other images be too crowded? Let us know what you think!


Sources:

Dragga, Sam & Dan Voss. “Cruel Pies: The Inhumanity of Technical Illustrations.” Technical Communication 48 (2001): 265-74.

First Attempt

For our next project, we were assigned to create an infographic about disease spread on a cruise ship (I think). According to the PDF the class was provided with, from my understanding, the infographic had to meet the following requirements:

  • Appeal to a scientific community of epidemiologists
  • Have a min 200ppi resolution as it will be in a scientific publication
  • Be centered around a 3D cruise ship
  • Show all the components of an infectious modeling system
  • Study an infectious outbreak on a cruise ship

The information provided is still kind of vague and left me with so many questions. Is there a specific article the infographic is for? Is the data already provided? What are the components of an infectious modeling system? Are there design restrictions on the color and layout?

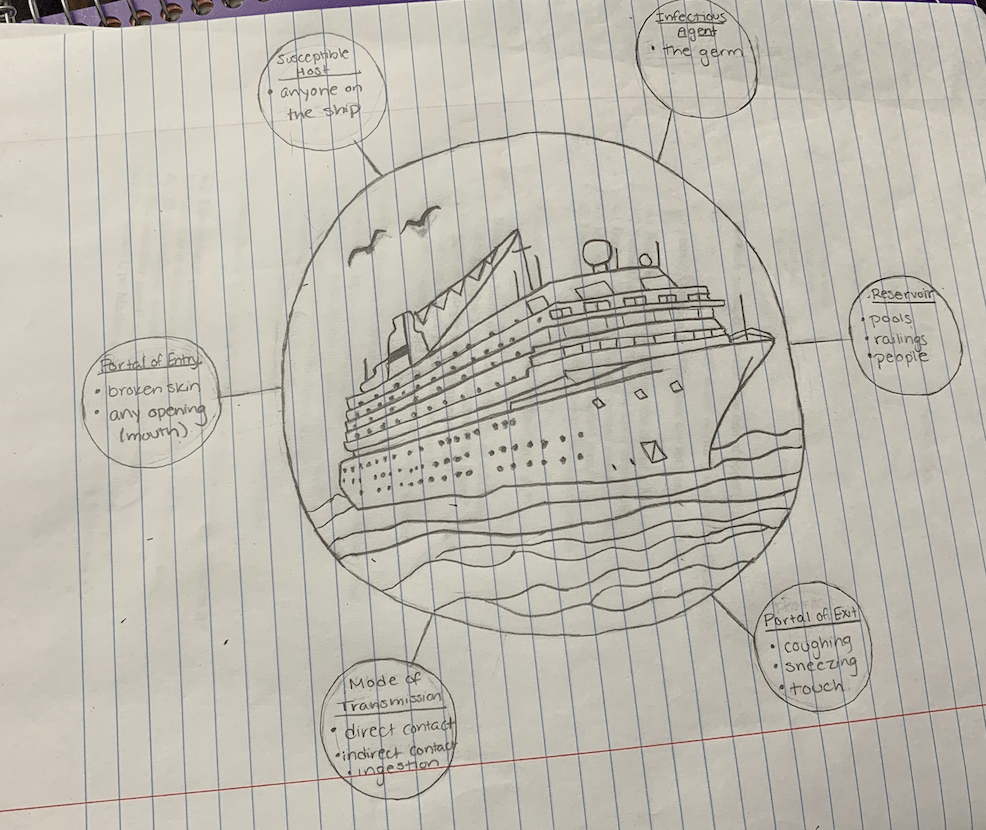
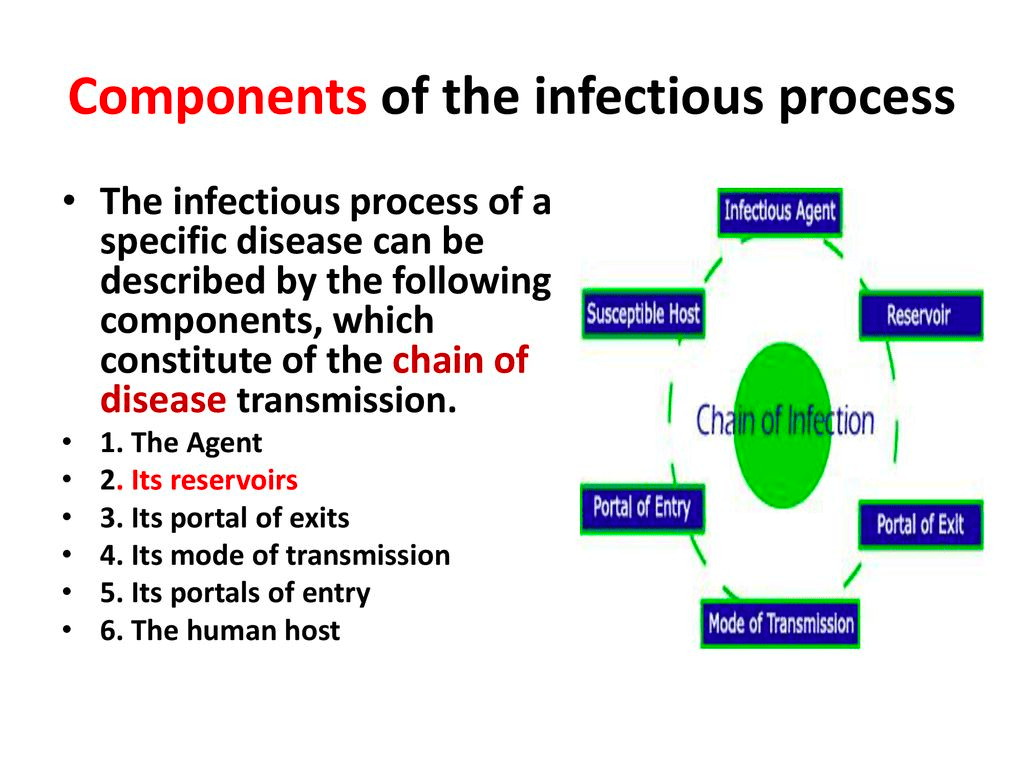
After a google search, I think I found the components of an infectious modeling system as seen in the graphic below:

Components of the infectious process. Photo courtesy of Hatim Jaber.

One question answered. Yeet.

Without further information from the client, my partner and I came up with a (very) rough draft:

Our initial draft consisted of the ship centered with bubbles coming off of it. We wanted to have zoomed in images of each room. We thought our client wanted to see areas such as the bedrooms, pool/recreational areas, and the different levels of the deck in each of the bubbles. However, because this was only a first draft of our infographic, we did not have time for the zoomed in images. We personally thought the layout was a little confusing, so we wanted to fix it. According to American Statistician Edward Tufte, “There are right and wrong ways to show data. There are displays which reveal the truth and displays which do not” (Tufte 20). We wanted to make sure we were sending the right message, but at this point, we were unclear of message our client exactly wanted. We were unsure what information the audience was intended to gain from our infographic–were they supposed to see the specific virus hotspots, the stages of the virus itself, the methodology used, or a summary of the entire article?  We wanted to make sure that our client’s data was shown in the right way.


Sources:
Tufte, Edward. Envisioning Information. Cheshire, CT: Graphics P, 1990.

Create your own website, free on WordPress.com.Create your own website.
Start free